
Pandas Profiling for Quicker Data Understanding
Read your data? Pause. Generate the Pandas Profiling report first.


Early this year, I worked with a client in which our task was to present interesting insights about their customers and perform some clustering and segment them. Now, this may sound fairly easy unless you should see the data, the real-world raw data.
It took us days to clean the data to be able to do some analysis. And we didn’t know if we cleaned it well, thanks to the client for not having a data dictionary. The real problem was it took us a lot of time to understand the data. And on top of it all, the frequency of us receiving similar data was high, and we were spending a lot of time cleaning and inspecting the data. It was high time we needed a solution.
A solution to quickly inspect, understand the data, and reduce the time it took us to clean the data so that we can focus more on the modeling and segmentation phase.
Pandas Profiling to the rescue
After some research, I came across a few libraries and software, which address data cleaning's pain point. Some claim even automatically to clean our data (are we there yet?), some introduce many additional dependencies into our code, and so on. But then I found the right one.
Enter Pandas Profiling.
The promise of Pandas Profiling is plain simple; it helps fast track your exploratory data analysis through quicker data understanding. With additional 2 lines of code, generate a profiling report of your data, understand and detect your data issues in a matter of minutes, and focus your time on preparing the data for modeling.
Ever since, here’s my mantra.
Read the data? Pause. Generate the Pandas Profiling report, inspect the data. Now start cleaning and exploring the data.
In this article, I’m going to share everything you need to know about Pandas Profiling. We will start installing the package, walk through an example of reading a dataset, generate the report, and inspect the data using the report.
Let’s get started, shall we?
The Unusual Example — Getting Started & Beyond
If you had read some of my previous articles, you would know that I grab concepts better with examples. And I teach better with examples. Examples make the process of teaching and learning 10x effective. Which example are we going to use today? I hear you ask, let’s pick something unusual.
There have been thousands of meteorites that have landed on our earth through the years. The Meteoritical Society collects data on meteorites that have fallen to Earth from outer space and available to us from the NASA website. And it’ll be fun the explore the hidden insights of meteorites landings!
We have chosen the NASA Meteorites Landings dataset, which can be downloaded from their website. This dataset includes the location, mass, composition, and fall year for over 45,000 meteorites that have struck our planet.

Getting started
Installing the library is pretty straightforward. Fire up your terminal and run the following command. That’s it; you have it!pip install pandas-profiling
Generating the report
Generating the Pandas Profiling report is as straightforward it can get. Let’s dive into the code, shall we?import pandas as pd
from pandas_profiling import ProfileReportdata = pd.read_csv('Meteorite_Landings.csv')
ProfileReport(data)
That’s it; if you’re using Jupyter Notebooks, the entire report would be generated as an output. There exist more advanced customizations as well, should you need them. But the code chunk above is what I typically use.
Inspecting and Exploring the Data
A common misconception with the users of Pandas Profiling is that it replaces exploratory data analysis. Wrong. It can only supplement your exploratory data analysis. You still have to use the skills you have developed as a data scientist to further clean and explore your data; Pandas Profiling makes it quick and easy!
Let’s quickly dive into what’s in store for us in the profile report, shall we?
There are special individual sections available in the generated report, which we will briefly go through. You can also find the same report here to follow along.
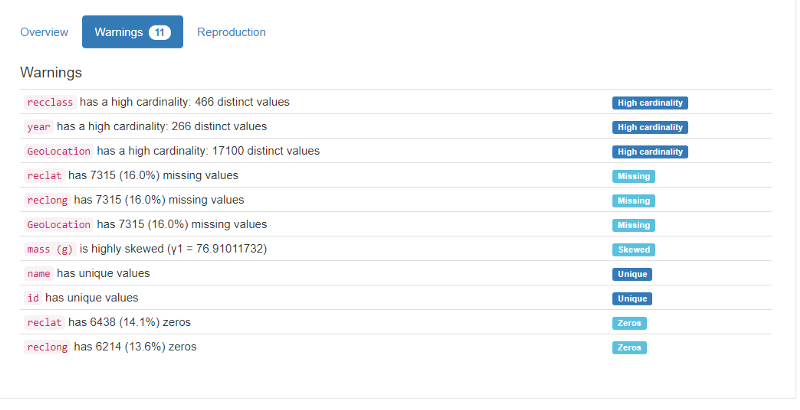
1. Overview of the dataset
The overview section is what you need to glance at if you’re in a hurry. It’s got a summary of the number of columns, types, missing data, etc. This information can anyway easily be obtained from the pd.describe() function itself. But what impressed me was the warnings section, where I get to know which variables I need to pay more attention to. It flags high cardinality, missing value percentage, zeros, and more.
2. Variables or columns
This section provides complete statistics for all the columns of the data. We have descriptive values such as mean, max, min, distinct; quantile values such as Q1, Q3, IQR, and finally, histogram plots for the data distribution.
This way, we can understand the variables better before we proceed on to more in-depth data analysis.
3. Interactions & correlations between variables
So far we looked into univariate statistics — meaning understand the columns as it is. But when it comes to performing machine learning on the data, the interactions and the underlying correlations are crucial. In the broadest sense, correlation is any statistical association, though it commonly refers to the degree to which a pair of variables are linearly related. Machine learning is all about correlations.
Understanding correlations can help us build an intuition of what the most valuable features are to predict the target variable at hand. We make intuition for variables selection as to which variables exhibit the strongest correlations to the target variable.
The interaction plot visually shows us the variation of values between any 2 columns. In contrast, correlation is more of a statistical measure measured using various coefficients such as Pearson's, Kendall’s, and Spearman’s. Both of these are important for machine learning problems irrespective of whether you’re using Pandas Profiling.
4. Missing values
First, the overview section had already raised a warning on missing values on particular columns upfront. Here we have a dedication section to deep-dive into it.
Handling missing values is a common problem faced in most data science problems. It is crucial to ensure that missing values are appropriately treated, either by dropping columns with a high percentage of values missing or using the right imputing mechanism.
5. Sample
This section provides a sample, typically the first and last 10 rows of the data. I rarely find this sample useful, especially after all our inspection, but some data scientists still like to look at the head and the tail of the data; hence this report’s got a sample section!
6. Duplicate rows (if any)
When duplicate rows are present, the reports list down all the duplicated rows in a table. I view this to inspect which ids/keys are generally duplicated to get some intuition.
I can’t really think of a better way to generate all these insights about the data in a matter of minutes. But this is just the first step, not the end of exploratory data analysis. As data scientists, we should take this report as a stepping stone to expedite the data cleaning and explorative phase.
Final thoughts
In this article, we introduced Pandas Profiling, which enables quicker data understanding within a few lines of code. We also saw how to use and what features are there for us in the generated report. I was surprised when most of my colleagues weren’t aware of this simple tool. I was happy to introduce it to them. Now I’m sharing it with all of you, my dear readers. I hope this was useful to you, and I’d love to connect and hear your feedback. Meanwhile, I’d keep writing valuable articles for you here at Medium.
As data scientists, I firmly believe that we need to learn to use the tools that best suit the need. In the end, our skill in using these and making our life easy is what matters.