
How I Learned Tableau in 1 Day
From installing the software to delivering a dashboard


I am a Machine Learning Engineer and have always been relying on Matplotlib, Seaborn, and Plotly for all of my visualizations (C’mon, we all do, right?). To me, lengthy Python codes were really cool, but drag-and-drop plots were not. If any of our products need some classy visualizations, our BI team comes to the rescue. So two years passed by with me learning neither Tableau nor PowerBI.
However, I ended up learning Tableau, creating a decent dashboard with findings for a few business questions, and sharing them with the stakeholders. All this in a single day.
The why
With this experience, I learned that having a strong “why” is a crucial first step, as it helps us drive towards achieving the goal no matter the obstacles.
Find out your “why” first. It is the purpose, cause or belief that drives every one of us.
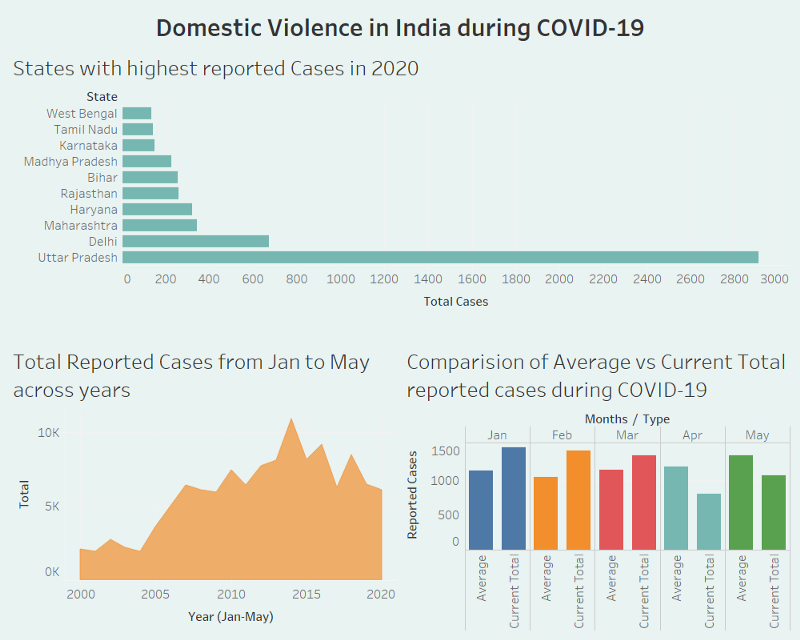
To give you a bit of context, I was volunteering for an ethical project analyzing domestic violence in India during COVID-19. This was hosted by Omdena — a bottom-up collaborative AI platform I absolutely love, in association with RedDot Foundation. For this project, we had several teams analyzing different avenues such as social media, news articles, and government data on domestic violence in India.
As we neared the end of the project, we had to unify our modelings and findings to deliver to the stake-holders. And in the end, it was decided that we go ahead with Tableau since it offers interactive world-class visualizations and most collaborators were comfortable with it. But I was not; I knew nothing of Tableau. But I cannot not convert the weeks of hard-work into real value.
The “why” differs from person to person. You might want to add the Tableau weapon to your data science armor. Or you might want to be able to produce stellar visualizations with minimal code. You might even have a Tableau assignment given out to you during your interview by your dream company. Understand your “why” first and proceed.
The how
I wasted no time in getting started. I downloaded the Tableau Desktop version (signing up for the 14-day trial) and installed it right away. Having the software on my machine helps me get hands-on while learning.
Next, I explored some options for Tableau beginner tutorials. After spending some time researching, I found the official tutorial by Tableau extremely useful. The entire getting-started tutorial had step-by-step guidance in text form and was easy to understand (Yes, text tutorial!). The beauty of this was, it lets us skim through the complete tutorial in a couple of hours, understand the complete workflow, and use it as required.
I followed freeCodeCamp’s crash course to supplement the official tutorial, which was about 30 minutes long. Known for the excellent work by freeCodeCamp, it delivered exactly what the title claims and enabled me to get started quickly.
I know I’ve only scratched the surface of what Tableau can do, but these were sufficient to get me started. The key here is for you to devise your own plan of action, with what works the best for you, and stick to it. Have a look at the above resources I recommended but feel free to explore the rest and choose the one that suits the best for your needs.
The what
So what did I create? My goal was to understand the patterns of domestic violence cases over the years and during the COVID19 lockdown in India. I created a basic interactive dashboard that conveys these summarized statistics at a glance and gives the stakeholders an understanding of India's situation regarding domestic violence.
It is important to have an idea of what you want to create. Create a stellar visualization to add to your data science portfolio? Or maybe you want to create basic plots to communicate your findings? You (must) decide your “what.”
Recap
Being able to create classy visualizations with drag-and-drop is cool too. We need to have an open mind and excel in the art of using the best tool as the situation demands. If you’ve got a couple of days in hand, here’s my recap of what worked for me to get started with Tableau, broken down into steps.
- Download Tableau Desktop version (even the free public version is fine)
- You probably have your own data; if not, browse through these datasets and pick one that is of interest.
- Write down 3 business/research questions that you would like to analyze.
- Learn Tableau with those goals in mind
- Create a dashboard analyzing the data and answering those questions
- Share it with the world! (Optional: Leave a link down here to your work, and I’d love to see and proudly share it as well.)
Looking back now, I realized I didn’t just learn Tableau, but I learned how to tackle down a task within a limited time.
Understanding the “why”, the “how”, and the “what” upfront, helps you learn with a purpose and create value.
It might seem obvious when you read it, but most of the time, we forget to apply this when we try to solve real-world problems.
Thank you for reading this far. I hope this article added some value to you and helped you get started with Tableau. Since I’m a real beginner in this, I’d love to hear your feedback on any flaws I might have made and how I can improve. Looking forward to connecting with you! :)