
How I Learned Looker in Just 1 Week
Looker for beginners: From creating your first dashboard to becoming a proficient LookML Developer

Early in my career, I’d say: building dashboard using drag-and-drop tools were uncool. I’d be immensely proud if I built dashboards using lengthy codes of python, matplotlib, plotly or streamlit.
C’mon, I’m a machine learning engineer. I want to code — not drag and drop.
So 2 years passed without me learning neither Tableau, PowerBI or Looker.
Eventually, for a project, I had to use Tableau. If not, all the month’s work goes to waste as we won’t be able to demonstrate the results to the stakeholders. I learned and built a Tableau dashboard in 1 day.
A lesson was learned: pick the best tool for a given task and upskill along the way.
Learning a new tool can be daunting, especially when it is an analytics platform like Looker, which isn’t available freely. But having done it once with Tableau, I know I could do it again with any tool. In this article, I will explain how I accomplished this and how you can do the same.
The Why
Honest answer. A company I’m interested in working for is using Looker. So I want to master the tool to maximize my chances. Simple as that.
I politely reached out to an employee of my target role on LinkedIn and asked her a few questions about the role and the company. This is what she said: “We use looker as viz tool, and we either use R/python to analyze data or create models.”
So I allocated myself a week to re-familiarize myself with Looker. Re-familiarize?
To be more transparent, I’m not entirely new to Looker. I first came across this tool in 2019, back when Google was still yet to acquire Looker. My company needed to pick a BI tool. I was in the team that went hands-on with a few use cases using several BI offerings, including Looker. We analysed the pros and cons of the selected BI tools. For our requirements at that time, PowerBI was the best option, and thus we didn’t pursue Looker.
If I didn’t have a strong why, I know I wouldn’t have revisited Looker, let alone done so within a week. You don’t have to have an interview coming up — it could be to learn and add the tool to your armour or to freelance your services.
Have your own version of why and you can do it too.
The How
Mastering Looker was a bit complicated. Let me explain.
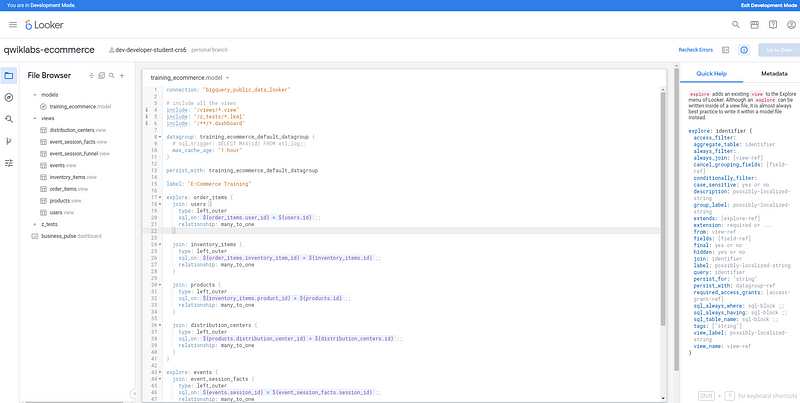
Looker uses LookML (Looker Modelling Language) to describe dimensions, aggregates, calculations, and data relationships in a SQL database. We have to write a model in LookML to run SQL queries, so think of it as a wrapper language for SQL.
In addition, having to use a new language, Looker isn’t available freely to the public. The all-new Looker Studio is but the enterprise version, where most companies are at, isn’t. By December 2022, they made it generally available, but you still have to go through the GCP Sales team.
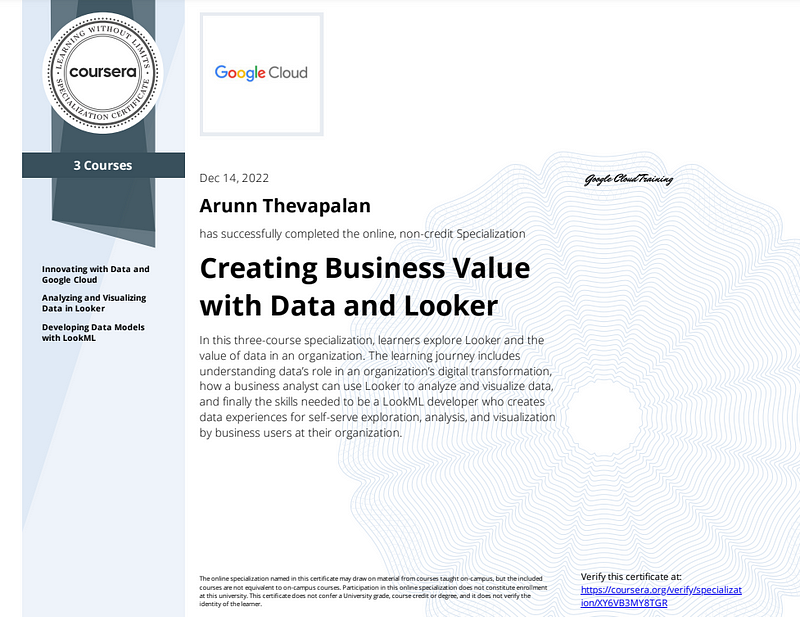
To un-complicate this, I took the Creating Business Value with Data and Looker Specialization by the GCP on Coursera. I’m not even going to use the affiliate link (and make less money for me) because I want you to finish it during the one-week trial for free.
Now you can,
- Set a goal to become proficient in a week.
- Sign up for the specialization trial.
- Keep this article as your guide through it and accomplish your goal.
I see Looker’s steep learning curve as an advantage: thanks to the barrier to entry, there will be fewer professionals in the job market with expertise in Looker. Guess who’s getting all the LinkedIn DMs?
I got another (aside from my target company) Looker interview just the day after I shared about completing the Looker specialization on LinkedIn. The interviewer said he’s been trying to recruit for the past 30 days and has yet to find a suitable candidate.
I revealed that not to boast but to inform you of the shortage of skilled Looker experts in the job market.
The What
First, let’s go over what I learned, and then I’ll show you what I built.
Looker isn’t just a dashboarding tool but also helps senior non-tech folks work independently of the techies.
In one of my previous roles, we had “data requests” from the business team, which was a real pain. They want to answer a few business questions and understand the short-term impact the business is facing. Since they aren’t skilled in retrieving data from the database, they’d raise a “data request”.
From the tech team, we had a roster within the data team who would take turns to tackle these requests, as we can’t ignore them due to the business value these analyses and decisions provide.
But what if the business team can directly access a view of the database in a drag-and-drop manner? Looker has an “Explore” feature which enables business teams to create views and dashboards on their own.
It’s a win-win because we, the data scientists and data engineers, can focus on building models and adding more value than performing routine data requests.
4 core analytical concepts drive all data analytics processes on Looker.
I practised with these several times, so I understand how the business user goes about using LookML on a day-to-day basis.
- Dimensions are unique attributes (also columns) of the data that help you to describe data. You can also transform the existing columns to create new dimensions. For example, you could create a column for “Customer Loyalty Duration” if you have their first purchase and today’s date.
- Measures are aggregations of one or more dimensions (or columns), such as a count or average. These are useful when you want an overall view of different granularity. For example, you want to know the average sales order of each customer.
- Filters are ways to narrow or subset your data based on specific criteria and can be applied to dimensions or measures. For example, you might want to know the average sales order for the bakery department of a retail store.
- Pivots allow you to create a selected dimension into several columns (similar to pivot in Excel). It becomes handy when we want to get metrics by a different grouping of the data.
As a business user, with these 4 functions, you can find answers to your business questions through visualizations.
Looker to integrate data sources, build data-driven workflows, and create custom data applications.
Once you know how to make the most as a business stakeholder, you have another pathway which is more technical, i.e. LookML Developer.
Yes, companies have dedicated roles for LookML because this person becomes the backbone of the BI architecture and should be able to create models that power the 4 core data analytics processes we saw earlier and help create dashboards uncovering business insights.
So what did I build?
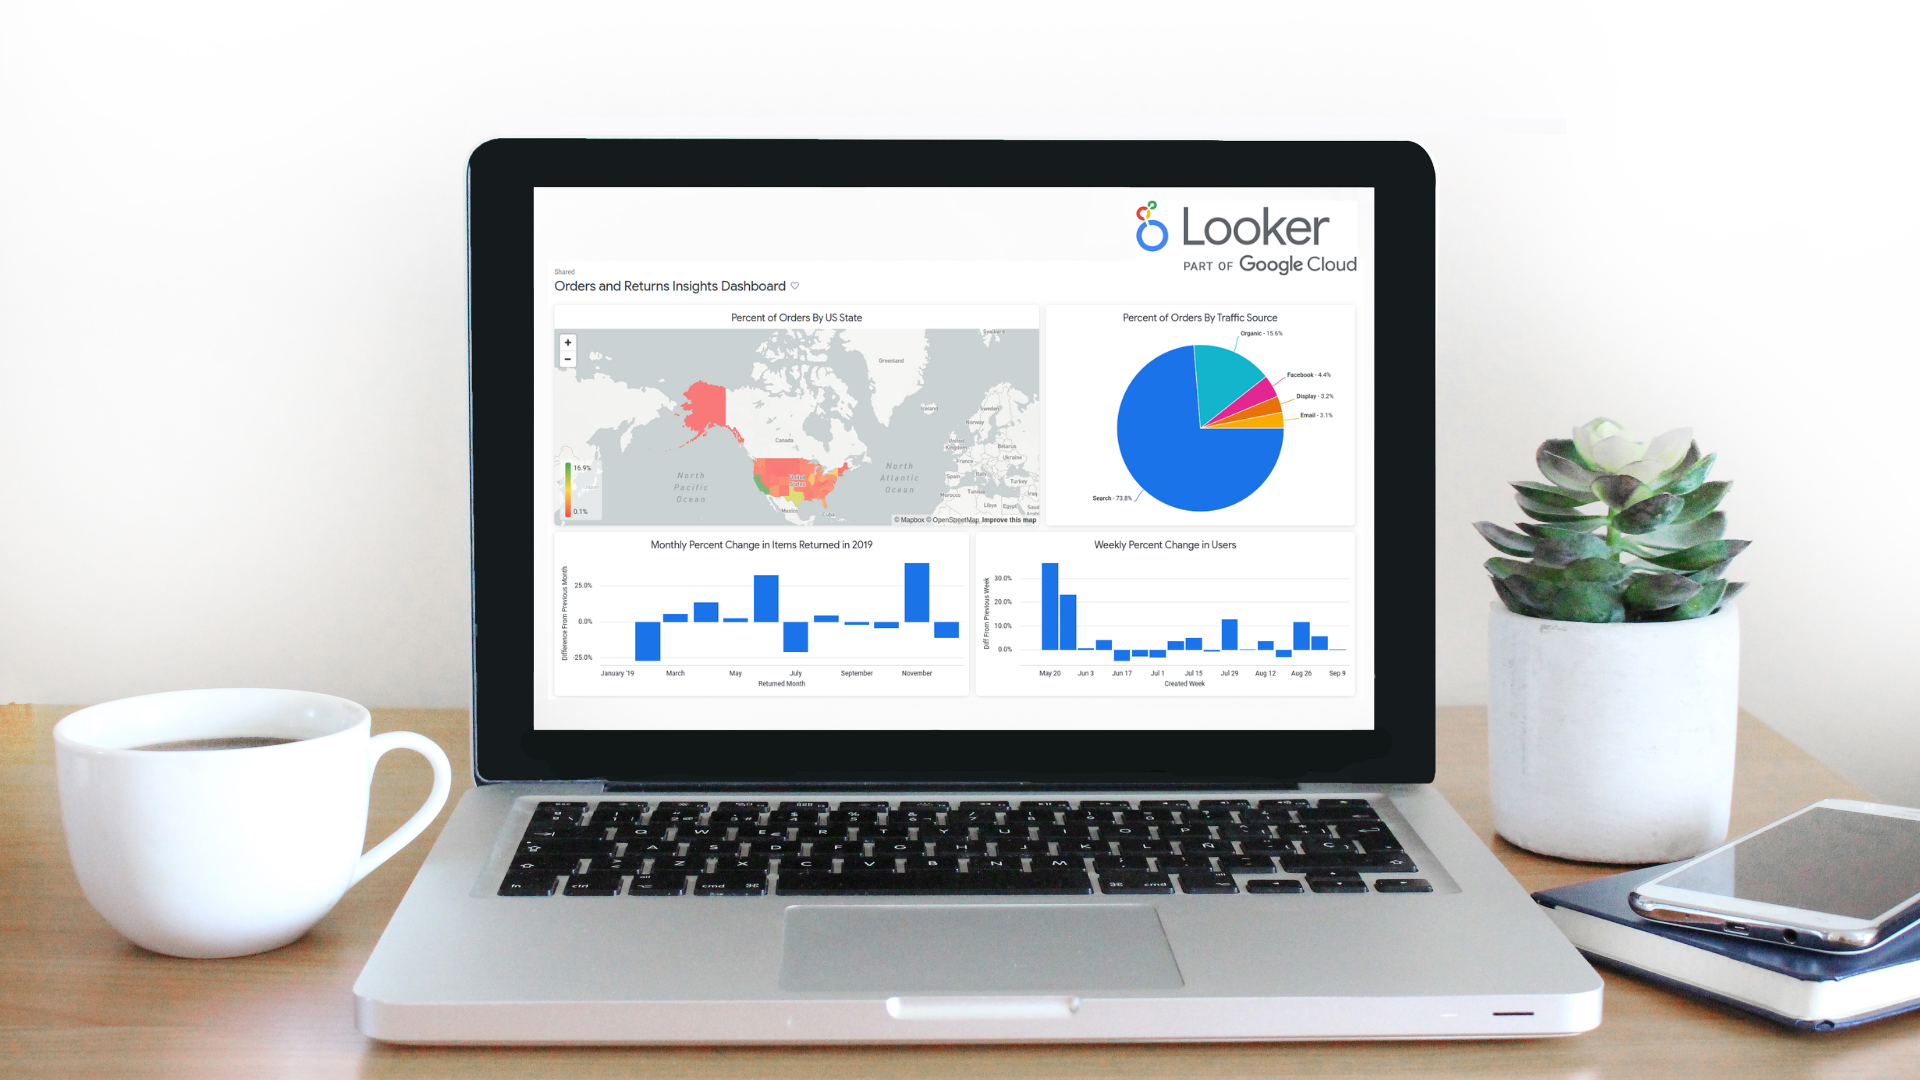
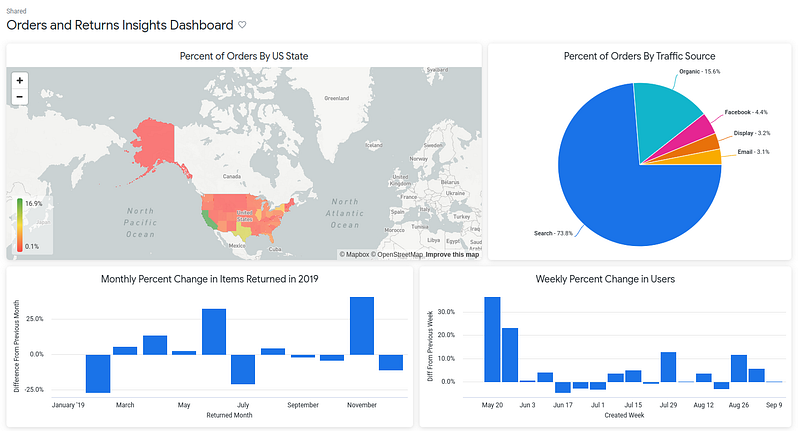
Considering an e-commerce company that operates across the USA, with data on their users, their orders and returns over a few years, the questions I tried to answer were:
- What percentage of completed orders accounts to each state in the US in the past 1 year?
- What are the drivers of traffic (and their percentage) for each completed order in the past 1 year?
- What is the monthly percentage of change in items that were returned (after a completed order) in 2019?
- What is the weekly change in the percentage of active users on the platform? (active definition is subjective)
My target company is an online marketplace, so I felt this would be relevant. Here’s the snapshot of the dashboard I created:
If you’re not sure what to create, just go with the instructions of the hands-on lab. After you’ve gotten the hang of the platform nuances, feel free to explore further on the platform with different data and relevant business questions.
Being able to uncover insights through drag-and-drop visualizations is cool too.
That’s what the entire experience taught me.
In short, Looker enables:
- easy and independent access (and review) of the data
- answer business questions with a few drag-and-drop actions
- daily decision making made easy instead of waiting for a new report from the tech team
I can go on more, but it all comes down to the tool the company is already using. If your target company uses Looker, and you want to get the hang of it in a short time, here’s the best way to do it:
- Write down your “why”. Without a solid reason to learn Looker, you’ll read this article and move on.
- Be informed of the new updates on Looker Studio, Looker Studio Pro, and the rebranding of Data Studio, as Google focuses on Looker being its unified BI tool. Expect more changes.
- Take the Creating Business Value with Data and Looker Specialization.
- The data is already loaded in the Looker instance, so after familiarizing yourself with the data, write down three business questions.
- Go hands-on with the Labs, answer the questions you wrote down through a dashboard with visualizations (also complete the assignments)
I’m not going to claim I’m a Looker expert, but I plan to use this foundational knowledge and improve myself. I’ll be working on creating more visually pleasing dashboards from the freely available (new) Looker Studio.
Hopefully, I will get ace the take-home assignments and get through the interviews and get to work on real-world setup in my target organization.
Fingers crossed!
For more helpful insights on breaking into data science, honest experiences, and learnings, consider joining my private list of email friends.